NASA Study: Excess of Mass Gains of the Antarctic Ice Sheet over Mass Losses during 1992 to 2008 Eliminated by Increasing Dynamic Losses to 2016

14 April 2021
Last update: 15/04/21 10:00
A new NASA study [Antarctic Mass Balance] confirms that an increase in Antarctic snow accumulation [Siegert, 2003] that began 10,000 years ago in East Antarctica (EA) [Fig. 1] was adding enough ice to the continent during 1992 to 2008 to outweigh increased losses from its increasing glacier discharge into the ocean from West Antarctica (WA) as previously reported [2015 JOG paper]. Since most other studies reported that the Antarctic ice sheet was losing mass, those 2015 results on gaining mass were controversial. The new study derives consistent rates of mass changes over 24 years (1992 to 2016) using radar-altimetry data from ESA’s Envisat (2003-10) and gravimetry data from NASA’s GRACE (2003-16), in addition to the prior use of radar-altimetry data from ERS1/2 (1992-2001) of the European Space Agency (ESA) and laser-altimetry from NASA’s ICESat (2003-08).

(AP) includes DS24 – 27. West Antarctica
(WA) is divided into WA1 (Pine Island Glacier DS22, Thwaites and Smith Glaciers DS21, and the coastal DS20) and WA2 (inland DS1, DS18, and DS19 and coastal DS23). Includes grounded ice within ice shelves and contiguous islands.
The excess gain of 144 Gt a-1 (billion tons per year) of ice during the 1990s and 95 Gt a-1 during 2003 through 2008 was mitigating the total global sea level rise by 0.3 mm a-1, limiting it to approximately 3.0 mm a-1 [sea level rise] (36 Gt a-1 ice equals 0.1 mm a-1 sea level change). The losses from the Antarctic Peninsula (AP) had increased by 20 Gt a-1 due to the breakup of ice shelves and consequent glacier accelerations and the losses from the coastal portion (WA1) of WA had increased by 36 Gt a-1 from the acceleration and thinning of outlet glaciers. If Antarctic ice losses had continued to accelerate at those rates, the increased ice losses from WA would have balanced the long-term accumulation-driven gains over EA in several more decades, thereby ending the Antarctic mitigation of sea level rise.
However, the new study shows that beginning in 2009, the dynamic losses from the outlet glaciers in the WA1 part of WA strongly increased by 119 Gt a-1 (from 95 to 214 Gt a-1), which was further enhanced by an accumulation mass decrease of 39 Gt a-1 in the inland WA2 part of WA. Nevertheless, that total decrease of 158 Gt a-1 was not enough to bring the whole ice sheet into balance (input equals output), because there was a concurrent accumulation mass increase of 107 Gt a-1 in EA for three years (2009-11). While that temporary EA accumulation increase diminished, the loss from WA reduced by 71 Gt a-1 and the total ice sheet came into balance at -12 ± 46 Gt a-1 during 2012-16, thereby eliminating its effect on sea level rise.


The new study uses concurrent data from GRACE and ICESat for six years (2003-08) and novel methods to reconcile the difference between the mass changes derived from GRACE and those derived from ICESat, as were previously published. The key idea of the NASA authors came from recognizing that the respective GRACE and ICESat corrections for Glacial Isostatic Adjustment (GIA) come from changes in the mass and volume of the same material in the Earth’s fluid mantle under the ice sheets [Fig. 4]. Those changes are forced by the ice-loading history over thousands of years and strongly depend on the viscosity (resistance to flow) of the fluid mantle, both of which were not well known in Antarctica.
The authors use results from three leading GIA models to derive the ratio of the GIA correction for GRACE to the correction for ICESat, finding that the modeled gravimetry corrections are 5.22 times altimetry corrections over East Antarctica (EA) and 4.51 times over West Antarctica (WA), with corresponding inferred mantle densities of 4.75 and 4.11 g cm-3. Derived sensitivities of the gravimetry and altimetry corrections to bedrock motion enable calculation of the bedrock motion (äB0) needed to equalize GRACE and ICESat mass changes during 2003-08. For EA, äB0 is -2.2 mm a-1 subsidence with mass matching at 150 Gt a-1, inland WA is -3.5 mm a-1 subsidence with mass matching at 66 Gt a-1, and coastal WA is only -0.35 mm a-1 with mass matching at -95 Gt a-1.
EA subsidence is attributed to long-term Holocene (~ last 10K years) dynamic ice thickening. WA subsidence is attributed to low mantle viscosity in WA causing a fast uplift response to postLGM (~15K years ago) deglaciation, and to ice growth during subsequent Holocene groundingline readvance. These findings of widespread bedrock subsidence in WA, as well as in EA, differ from the prevailing uplifts given by the GIA models, and are supported by other recently published evidence of a history of increasing ice-sheet loading obtained from glacial geology, ice cores, and sediment cores, as well as the NASA authors’ satellite results of ice thickening in the inland WA2.
“We now have an accurate record of how the mass balance of the Antarctic ice sheet has changed over 24 years and the causes of those changes. Short-term changes for 3 to 8 years have been caused by fluctuations in snowfall and accumulation, but there is no significant trend during 1992 to 2016. Mass losses have increased from the dynamic thinning and faster ice discharge of outlet glaciers in West Antarctic, and the large long-term mass gain in East Antarctica has continued”, said lead author Jay Zwally. “However, our findings and those of others [e.g. Barletta and others, 2018] also include some good signs about the future stability of the West Antarctic ice sheet, about which there has been much concern and predictions of increasing mass loss”.
The authors of the NASA Study also compared the mass changes of the Antarctic ice shelves from 1992-2002 [Zwally and others, 2005] with the mass changes from 2006 to 2019 [Smith and others (2020)], showing there has not been a significant acceleration of losses from the floating ice shelves that help constrain the losses from the grounded ice sheet. During the first period the shelves in WA lost 57 Gt a-1, in AP lost 38 Gt a-1, and in EA gained 142 Gt/yr. In the second period the shelves in WA lost 76 Gt a-1, in AP lost 14 Gt a-1, and in EA gained 106 Gt a-1 giving an overall increase in ice-shelf loss of only 32 Gt a-1.
A 2020 review paper [Hanna et al., 2020] of published results and methods noted that “disparate estimates of the mass balance of East Antarctica, which vary by ~ 100 Gt/yr, have not yet been properly resolved.” That was followed by [Smith and others (2020)] that derived elevation differences between ICESat laser-altimeter data centered on 2006.3 and ICESat-2 data centered on 2019.0 finding a gain of 115 ± 21 Gt a-1 for EA, after adding 25 Gt a-1 to make the bedrockmotion correction comparable to the current NASA study that estimated 164 ± 55 Gt a-1 for EA for the same period, showing agreement within the overlapping uncertainties.
An issue with many other studies using radar altimetry is their inadequate correction for the highly time-variable penetration depth through the snow surface to the subsurface radar reflecting layers. Successful corrections for these variations were made for the ERS1/2 radar altimetry by the NASA authors and other investigators. However, for Envisat the interaction of the radar signal with the ice sheet surface and the sub-surface reflecting layers became more complex, requiring the use of an advanced correction developed by co-author Dr. Remy and her French colleagues. Using those advanced corrections for Envisat, the NASA authors obtain good agreement among the rates of elevation change measured over EA by ERS1/2, Envisat, and ICESat at the level of a few mm/yr, even though the periods of measurements did not exactly overlap.
For East Antarctica, most other investigators have assumed that the measured surface-elevation changes were caused by contemporary changes in new snowfall and accumulation, and therefore used the density of new snow/firn (~ 0.3 gm/cm3) to estimate mass changes from the elevation changes. In contrast, the NASA authors use meteorological analyses to show how much the snowfall and accumulation fluctuates up and down over periods of 3 to about 8 years, and to calculate how much mass is added and subtracted by these short-term accumulation fluctuations. The study also shows there has been no significant trend in snow input over the 24 years from 1992 to 2016.
After subtracting the elevation changes caused by the accumulation fluctuations, the authors find that the average ice thickness of the EA ice sheet has been increasing by 16.4 mm a-1 with a corresponding mass gain of 150 Gt/yr, which has been nearly constant over the 24 years. This long-term mass gain is the excess of the long-term snow accumulation over the nearly-constant rate of ice flowing out. The correct density for these long-term changes, considering thickening, is the density of solid ice (0.91 g/cm3).
The paper “Mass balance of the Antarctic ice sheet 1992–2016: reconciling results from GRACE gravimetry with ICESat, ERS1/2 and Envisat altimetry” by Zwally HJ, Robbins JW, Luthcke SB, Loomis BD and Rémy F is published in the Journal of Glaciology, and is available open access here.
Related Posts

Evidence for Presence of Snow Leopards Only Found in 75% of Himachal Pradesh’s Potential Habitat
Study finds that snow leopards only use three quarters of the presumed snow leopard habitat in Himachal Pradesh, India, raising questions about the way we map the cat’s distribution. Due to a lack of empirical data, our understanding of the distribution and abundance of the elusive snow leopard depends to a large extent on geophysical […]

Scratching the Iceberg – Undiscovered Lichen Diversity at Glacier Bay National Park
In this post we talk to Dr Alan M. Fryday and Dr Toby Spribille, Editors for The Lichenologist, about their Glacier Bay Special Issue which is available Open access. This was a study of profound intensity and detail, to make an important point about undiscovered diversity; why did you choose Glacier Bay as the focal area for investigation? […]
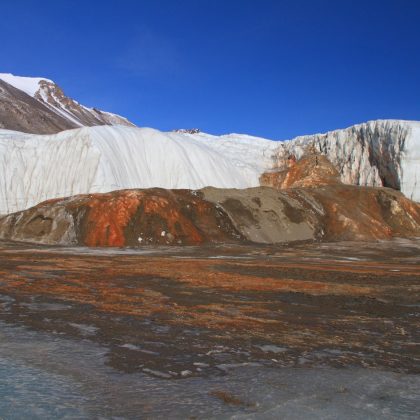
Solving the mystery of Antarctica’s ‘Blood Falls’
A study published in the Journal of Glaciology has solved a 100 year-old mystery involving a waterfall in Antarctica known as Blood Falls. New evidence links Blood Falls, a red waterfall in Antarctica, to a large source of salty water that may have been trapped underneath Taylor Glacier for more than a million years.

New study on the snow leopard in Mongolia reveals potential threats from increasing livestock
The study published in Oryx–The International Journal of Conservation indicates that increasing livestock numbers to supply the global market of cashmere have a negative impact on snow leopard’s wild prey, the Siberian ibex, and could undermine the long-term viability of the snow leopard itself. Scientists used camera traps to detect presence of wild mammals in […]

